
.jpg)
Survey Response Rates: The Decline Isn’t the Real Risk
Survey fatigue, selection bias and silent customers: how can you tell whether your listening program is still measuring what it should measure?
Survey fatigue, selection bias and silent customers: how can you tell whether your listening program is still measuring what it should measure?
When a response rate falls, the instinct is almost automatic: send more invitations, add a reminder, shorten the questionnaire or offer an incentive. These levers can help. But sometimes they answer the wrong question.
In fact, the challenge is not only to raise the response rate, but also to understand what silence means in your context, who continues to respond, and above all whether the responses collected still enable you to make useful decisions.
This is where survey fatigue becomes a customer-listening governance issue, not just a questionnaire problem.
Methodological research is clear on one point: a low response rate does not, by itself, prove that a survey is biased. AAPOR notes that the response rate is an essential indicator, but that it does not mechanically determine the extent of nonresponse bias. The decisive question lies elsewhere: do nonrespondents differ from respondents on precisely what we are trying to measure?
Benchmarks also show just how much context matters. In a CustomerGauge B2B benchmark, the average response rate observed is 12.4%, with results ranging from 4.5% to 39.3%. A 12% rate is therefore neither automatically good nor automatically bad. It must be interpreted alongside the type of customers, the relationship, the channel, the timing of the request and the quality of the database.
Our field experience also shows an important difference between B2C and B2B. In B2C, falling response levels can reinforce the overrepresentation of extreme experiences: very satisfied or very dissatisfied customers still take the time to share how they feel, while more moderate customers become quieter. In B2B, by contrast, a relationship survey can maintain high response rates when there is a genuine relationship with the salesperson or Key Account Manager. On strategic accounts, an unusual drop in response rate can then become a signal of relationship quality, not just a collection KPI.
And before concluding that fatigue is the cause, much more mundane issues need to be ruled out: incorrect email addresses, spam filters, the wrong contacts, duplicates, unclear invitations, overly broad targeting or poor timing. In other words, a poor response rate can begin long before the survey is sent.
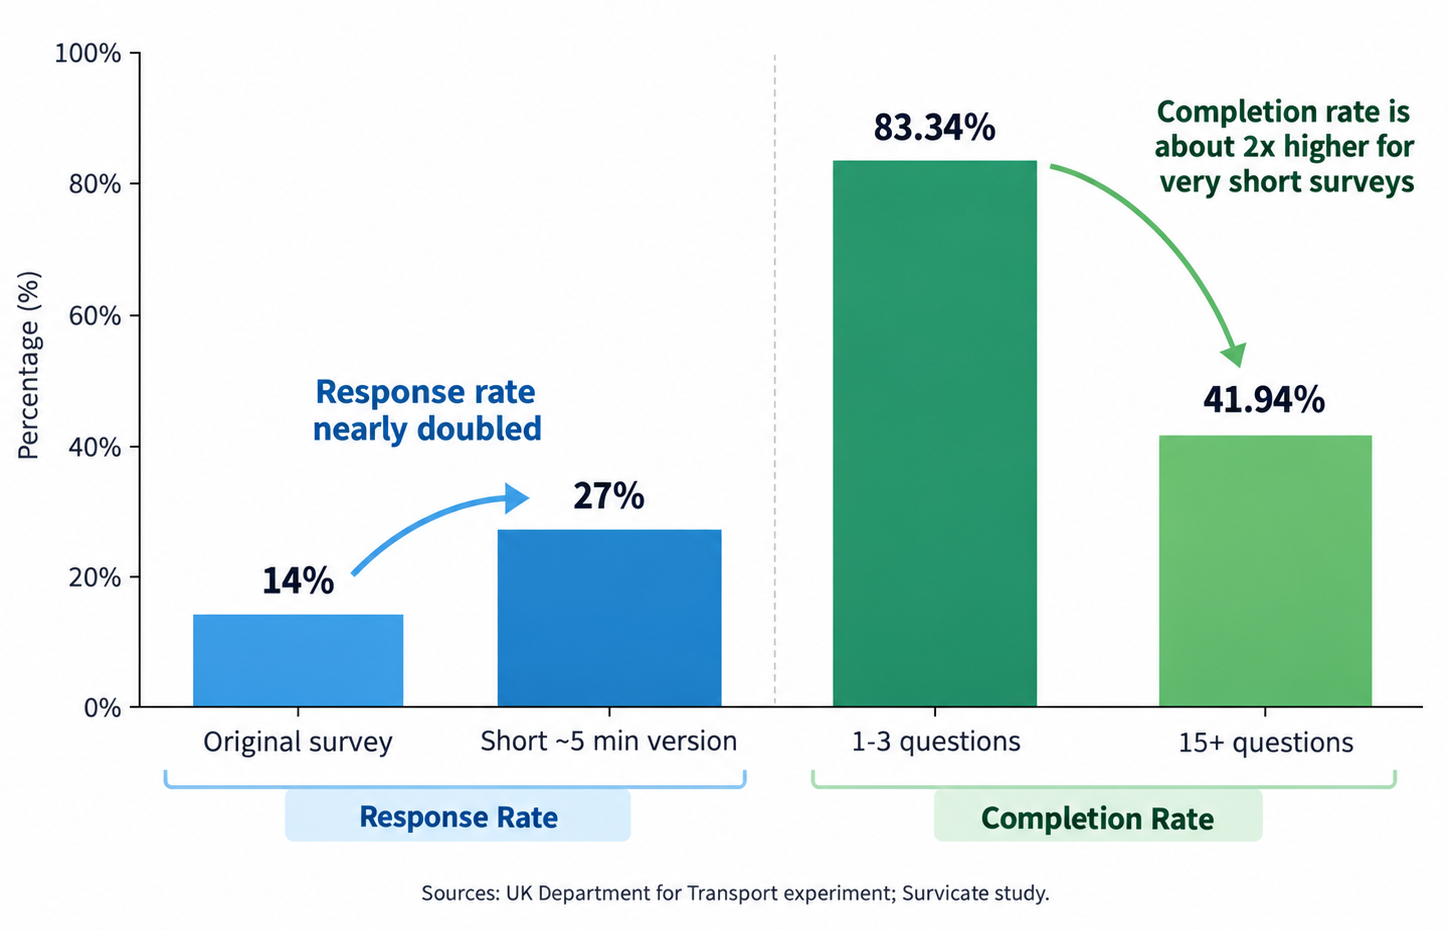
When it comes to length, the findings are much more consistent. In an experiment by the UK's Department for Transport, a short version of around five minutes increased the response rate from 14% to 27%, and the number of questionnaires completed persession nearly doubled. In Survicate's data, surveys with 1 to 3 questions average an 83.34% completion rate, compared with 41.94% for surveys with 15 questions or more.
But the most important effect is less visible. An experiment published in Public Opinion Quarterly shows that questions asked later in a questionnaire receive faster, shorter and more uniform answers. The respondent is still there; the quality of the information has already begun to erode.
This changes how a questionnaire should be designed. It is not enough to ask how many questions a customer is willing to tolerate. Every question must justify the effort it requires. And when a program tries to gain a few response-rate points through repeated reminders, it must also consider what cost this may be creating for the customer relationship.


This is probably the most important point from our practice. When we ask a customer what is wrong, we create an expectation. If they take the time to report a problem and then see no action, the company does not simply leave the original pain point unresolved: it adds a second disappointment, the feeling that the customer was not listened to.
Conversely, making the closed loop visible - calling a customer back, resolving a pain point, or simply showing "you told us / we did" - gives people a reason to participate next time. Several field observations point to the same conclusion: the ability to act on feedback is one of the most concrete drivers of future participation.
This is also why chasing the score can be dangerous. As soon as NPS, CSAT or the response rate becomes an end in itself, teams may start to optimize the measurement rather than the experience: selecting certain respondents, avoiding difficult populations, influencing the timing of collection or adding reminders until the desired volume is reached. The KPI then stops playing its role as a thermometer.
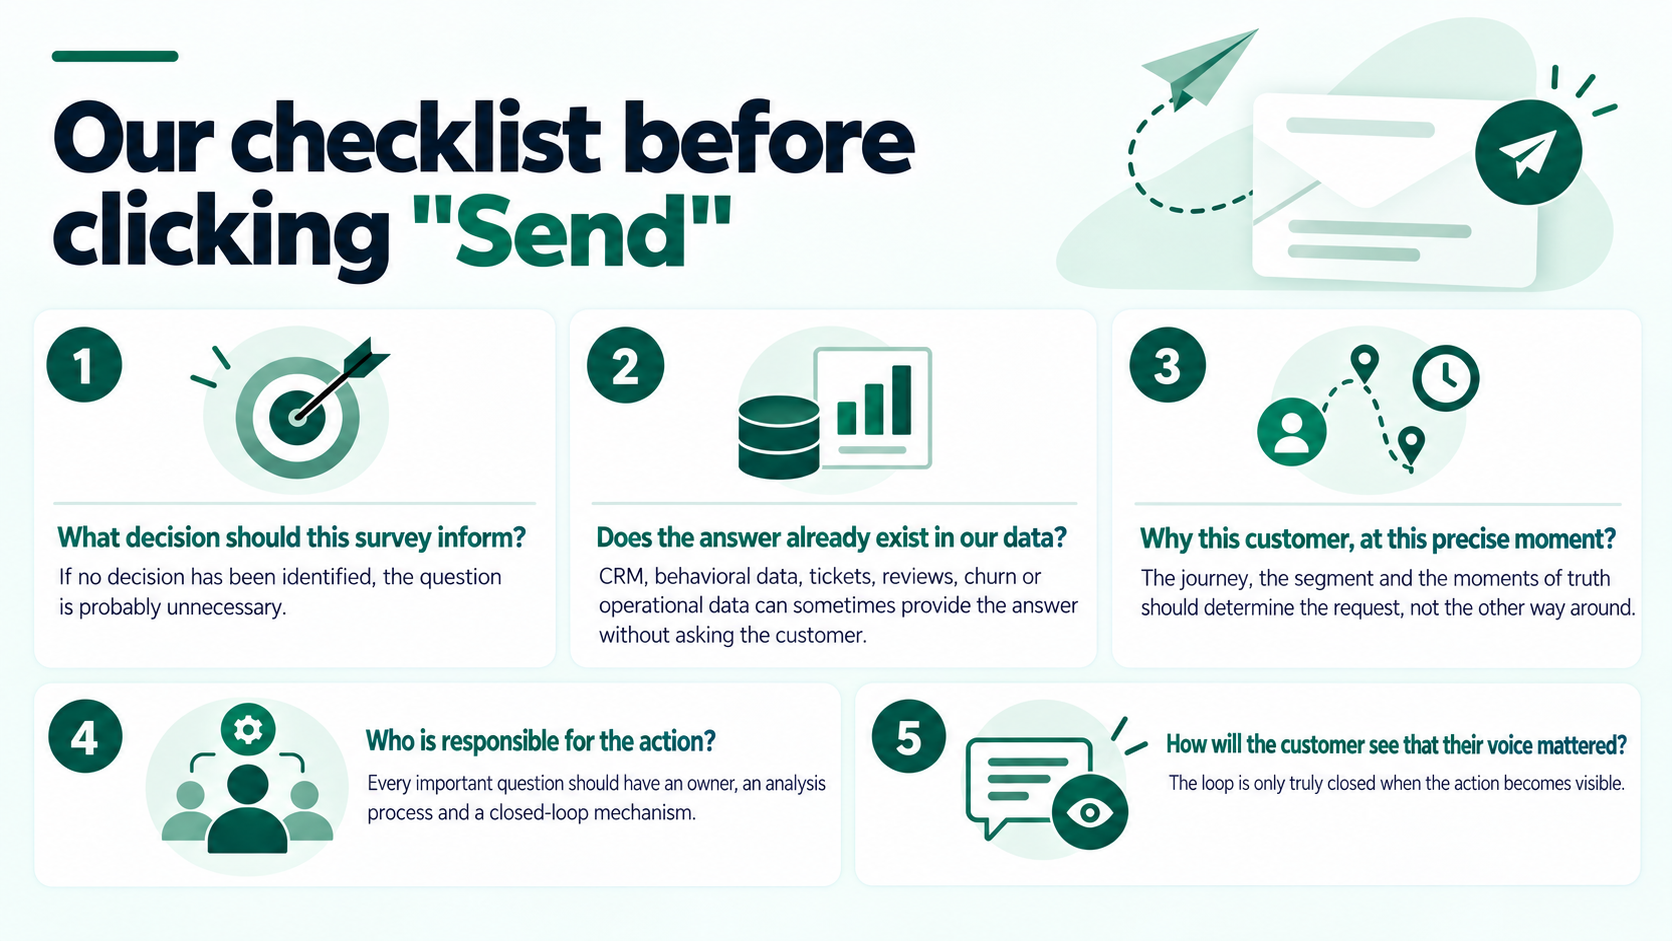

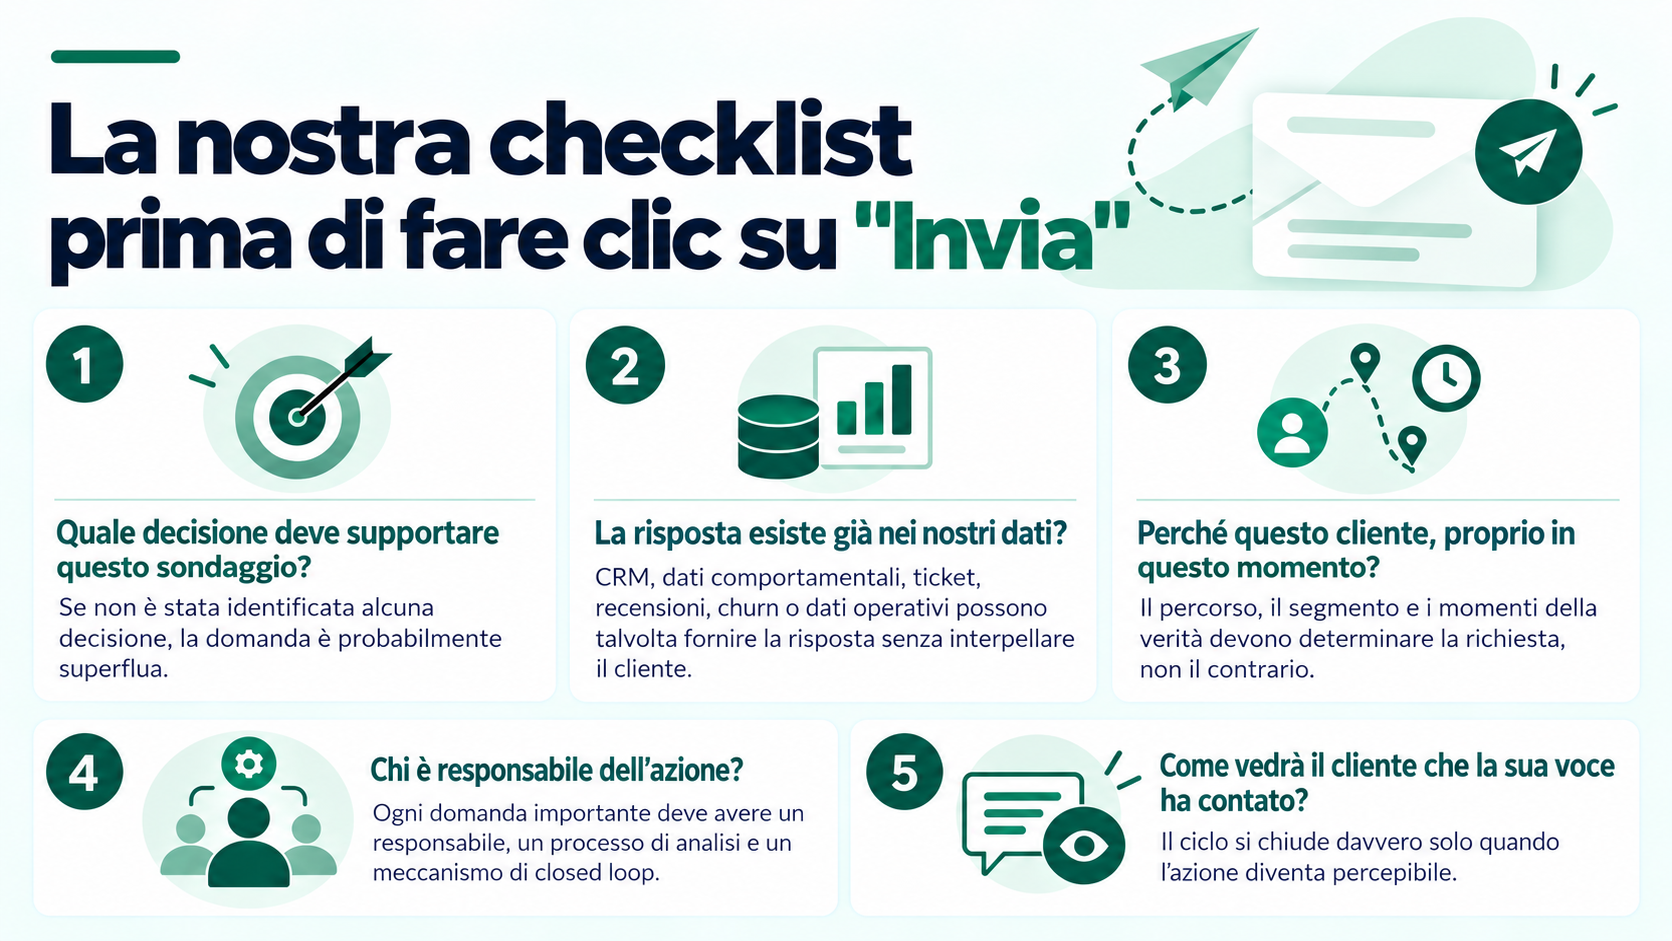
QUESTION → METRIC → INSIGHT → DECISION → ACTION
One idea has emerged strongly from our recent work on customer listening: surveys should no longer carry the entire Voice of the Customer on their own. Behavioral data tell us what is happening; feedback helps us understand why. If the CRM shows declining engagement, falling renewals, a surge in tickets or a customer gradually ceasing to use the service, there is no need to send twenty questions to confirm that there is a problem.
The right reflex is to start with what the organization already knows: complaints, customer-service conversations, verbatim comments, reviews, frontline signals, CRM data, product usage, purchasing behavior, retention and churn. The survey then comes in to fill a specific gap, especially the "why" that behavioral data do not reveal.
This logic matters all the more because silence is not the same as satisfaction. The Exit, Voice and Loyalty framework reminds us that a dissatisfied customer does not always choose to speak up: they may simply leave. A decline in complaints or a low volume of verbatim feedback therefore does not prove that the experience is improving. We need to look at what customers who do not speak are doing.
Qualtrics illustrates this blind spot well: after a very poor experience, only a limited share of consumers say they give feedback directly to the company, while another share tells no one. The absence of an explicit voice must therefore never be confused with the absence of a pain point.
The answer to survey fatigue is therefore not to eliminate surveys. It is to place them back within a broader listening mix and reserve them for moments when they serve a specific objective.
It starts with journey mapping. Not every touchpoint deserves a request for feedback. The moments most likely to damage the relationship need to be identified, and the approach then adapted to personas, segments and context. In B2B, a regular relationship survey may be relevant for taking the temperature of an account. In B2C, listening can focus more on a few moments of truth in the journey. Applying exactly the same measurement system to everyone is rarely the right answer.
It also means managing survey pressure at the customer level rather than at the silo level. Three teams can each send a "reasonable" survey and, together, create an unreasonable experience. Governance of customer requests must therefore take into account invitation history, context and the expected value of each request.
The response rate remains useful, but as a diagnostic signal, not as a standalone objective. It should be read alongside the open rate, survey starts, abandonment, respondent profile, segment coverage and the real ability to turn feedback intoaction.
The most interesting question may no longer be: “How can we gain five points of response rate?” But rather: “Which voices are we missing, which signals do we already have, and what are we going to do with the answers we collect?”
A short, targeted survey linked to a decision is better than an exhaustive questionnaire that no one reads - either before or after. And the best indicator of the health of a listening program may be less the number of people who respond today than the number of customers who will still have a good reason to respond tomorrow.
• Xperience 360 - The Death of the Survey Crutch: Finding a Better Listening Mix
• Xperience 360 - Chasing Response Rates: Why Your 5% Might Actually Be Enough
• Xperience 360 - Exit, Voice, and Loyalty: The Theory That Explains Why Your Customers Don’t Complain (They Just Leave)
• CustomerGauge - The State of Account Experience: B2B NPS & CX Benchmarks Report
• Qualtrics XM Institute - How Consumers Share Feedback, 2026
• UK Department for Transport - Rail Passenger Customer Experience Survey: Final Report of Response Rate Experiments
• Survicate - How to Get Survey Completion Rate of Over 80% (Real Study)
• Public Opinion Quarterly - Effects of Questionnaire Length on Participation and Indicators of Response Quality in a Web Survey
• AAPOR - Standard Definitions / Response Rates and Survey Quality
• Public Opinion Quarterly - The Impact of Nonresponse Rates on Nonresponse Bias: A Meta-Analysis